AI metadata in one click. You choose what to generate
You control what the AI does and what you spend
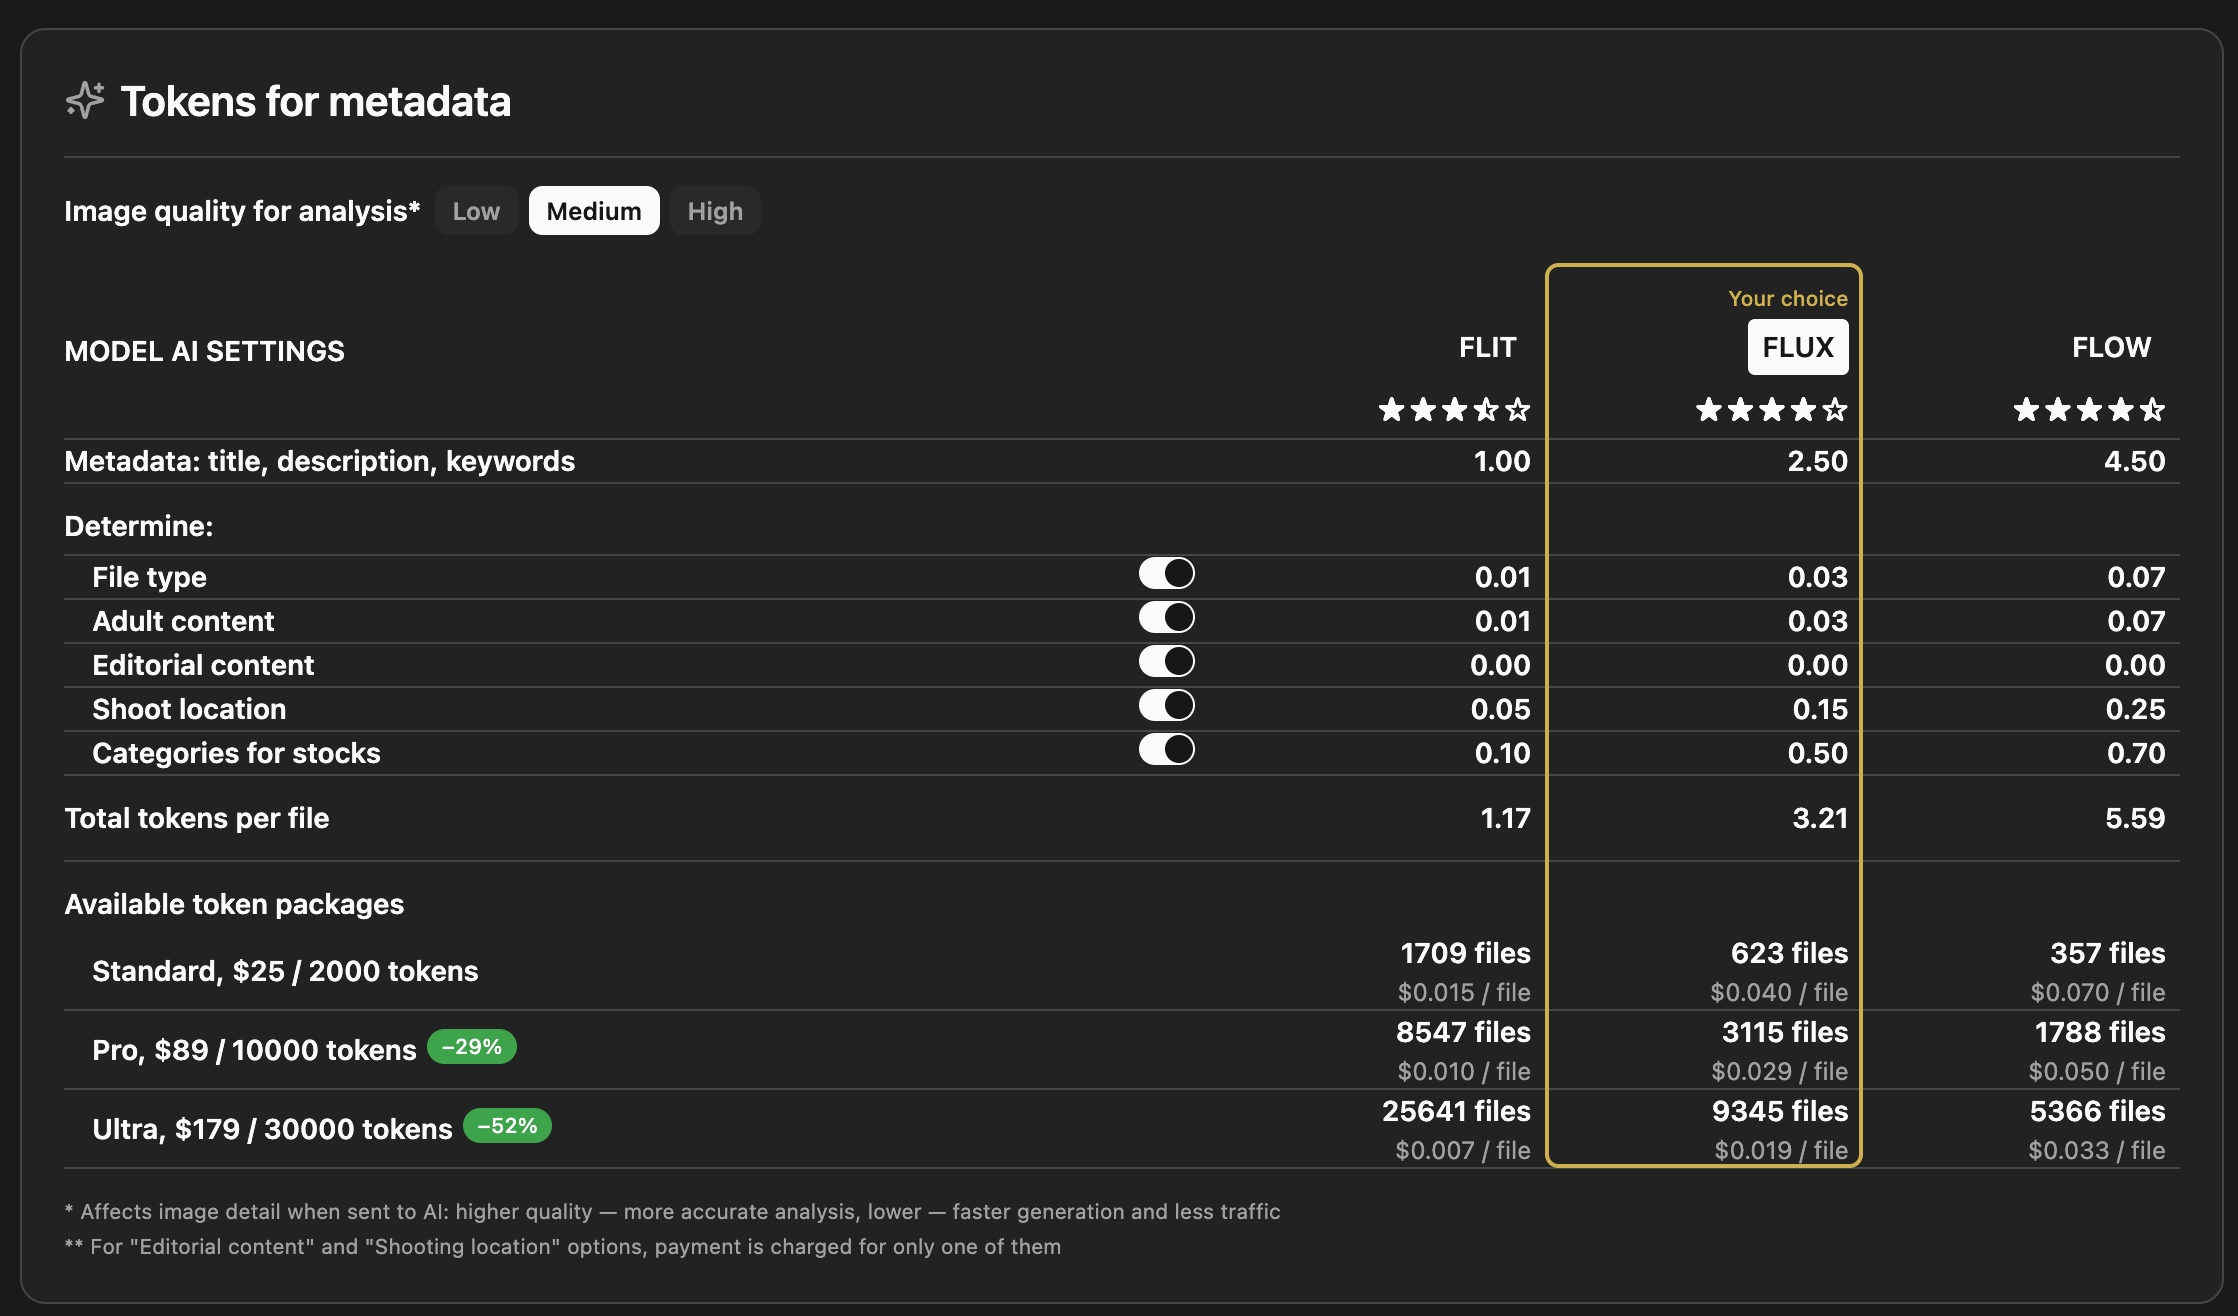
Three models: FLIT, FLUX, FLOW — different speed/quality and token cost per file
Base output: Title, description, keywords for every file; optional extras: file type, 18+, editorial, shoot location, stock categories
You control cost: Turn each “Determine” option on or off; editorial and location are charged once when both are used
Image quality: Low / Medium / High for analysis — more detail means better accuracy, slightly more tokens
Token packs: Standard, Pro, Ultra — more tokens, lower cost per file; see how many files you get per pack for your chosen model
Photography tips from AI. Quality and commercial potential
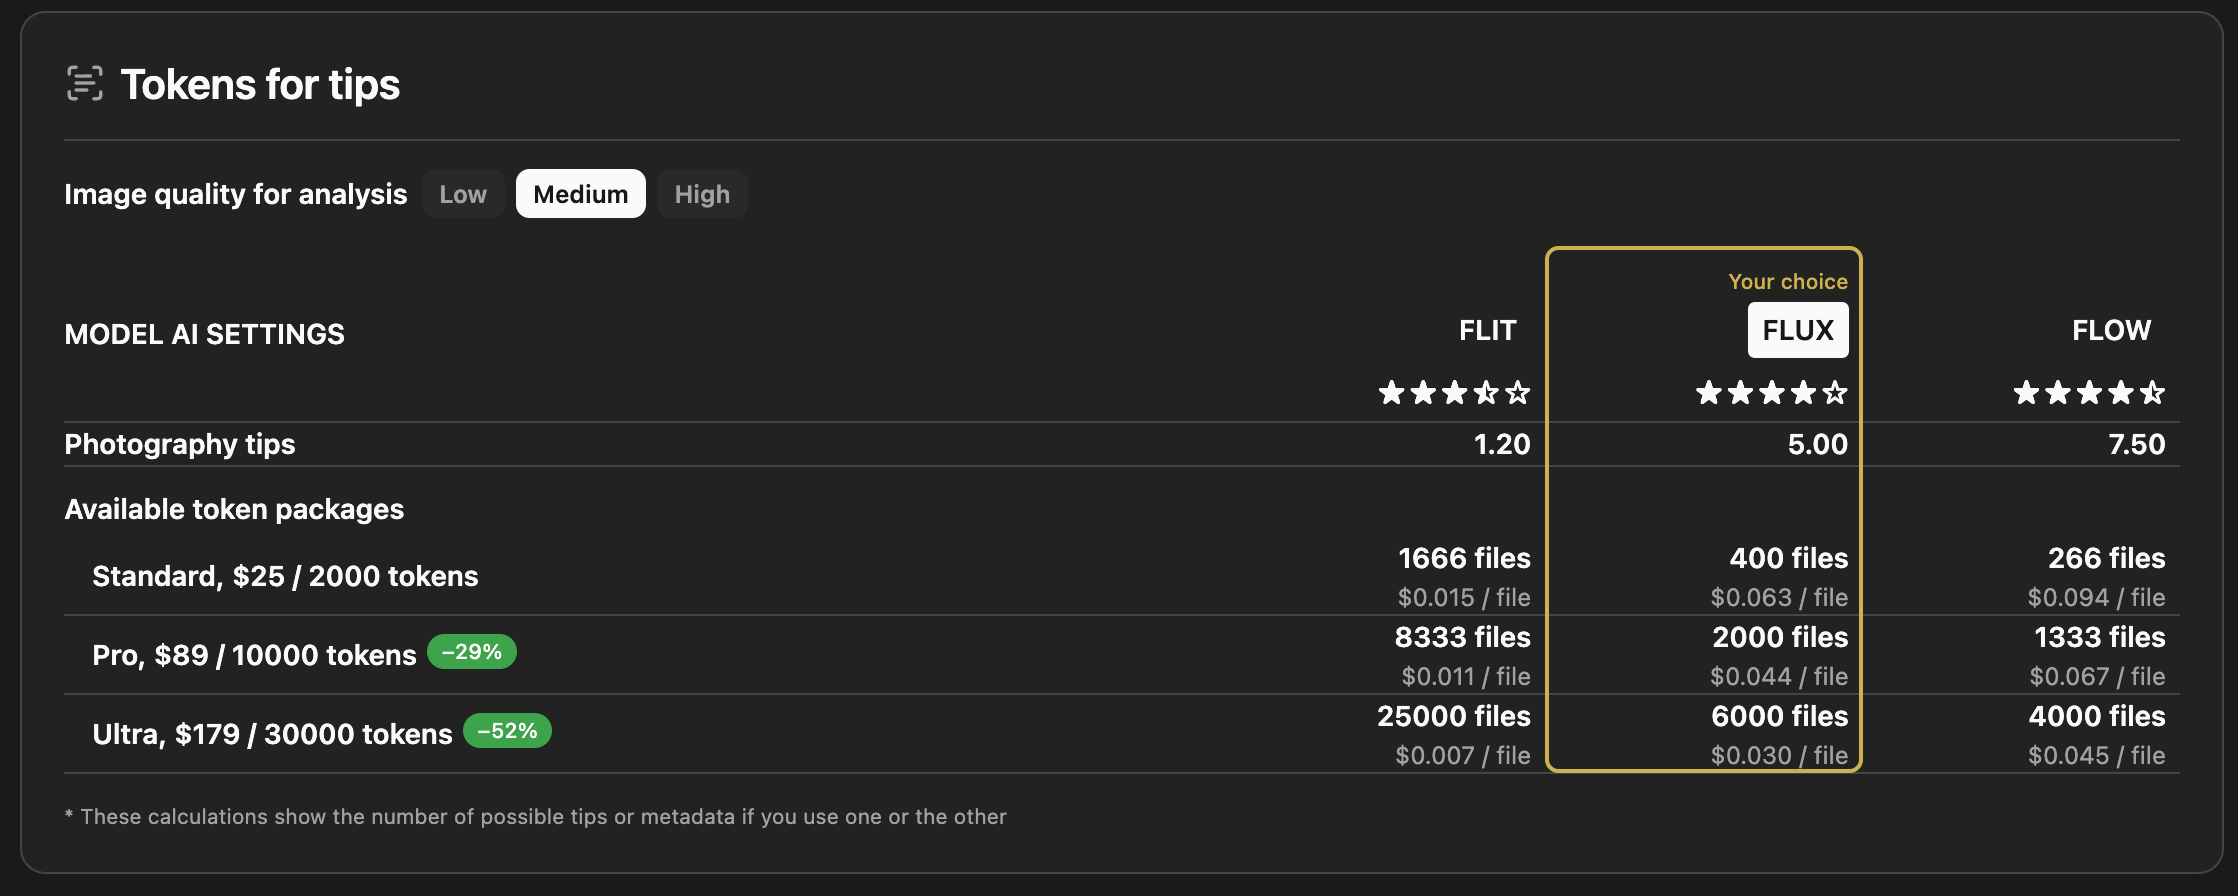
What you get: Short, actionable tips (composition, noise, sharpness, market fit) — not full metadata, just advice
Image quality for analysis: Low / Medium / High — again trades speed and token use for detail in the image sent to AI
Token packs: Standard, Pro, Ultra — same packs as for metadata; use tokens for tips, metadata, or both
Transparent cost: Each pack shows how many “tips” or “metadata runs” you get per model, so you can plan
See how you use AI. Statistics dashboard
Your usage in one screen. No guesswork
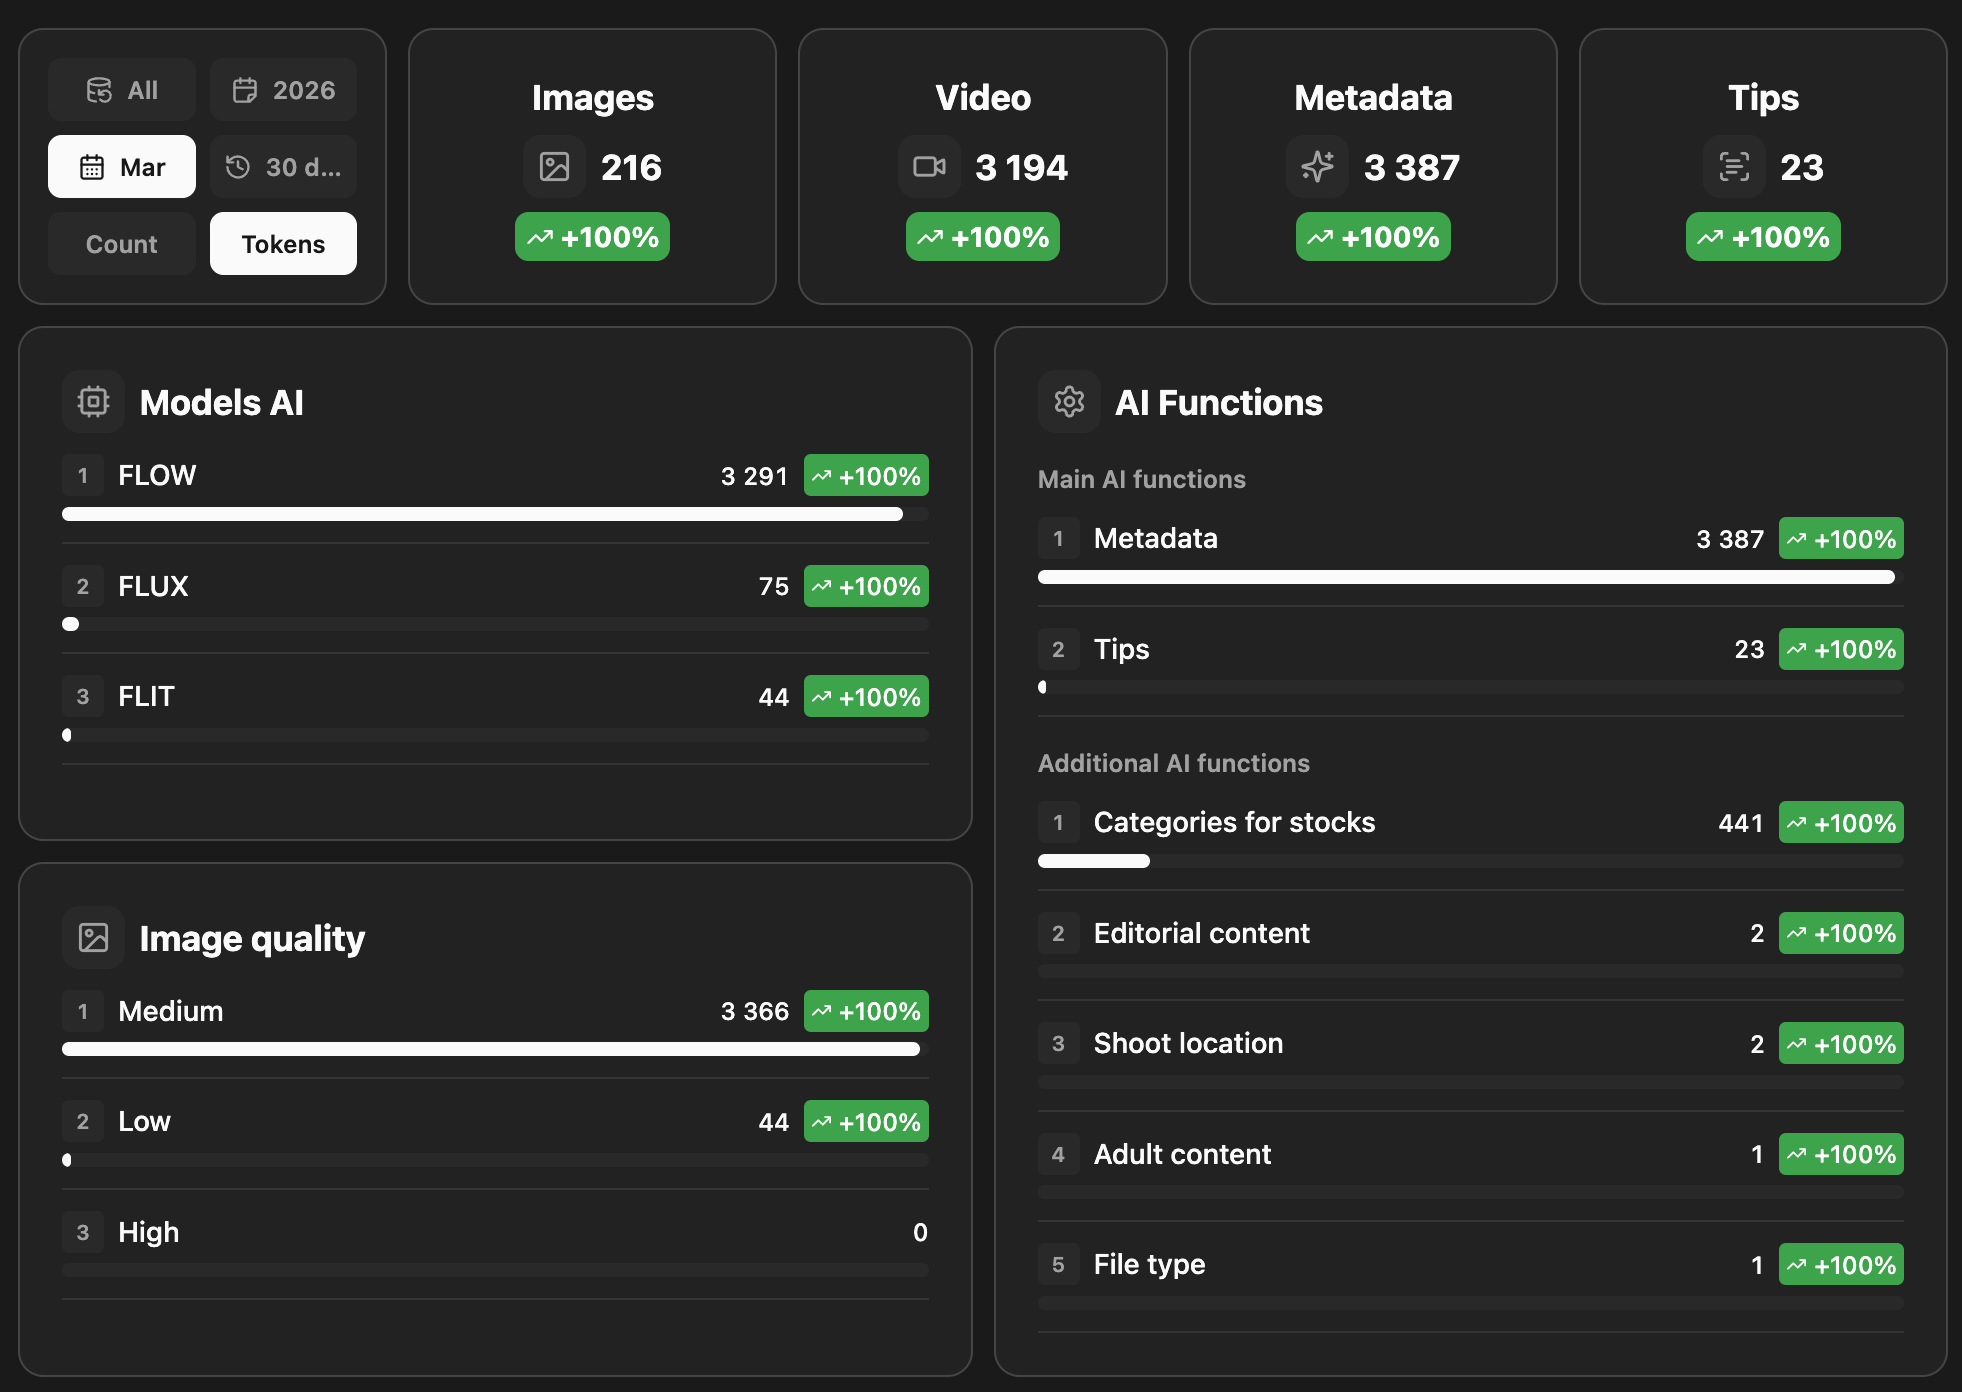
Totals: Images and video processed; metadata and tips generated — with simple growth vs previous period
Models AI: How much you use FLOW, FLUX, and FLIT — see which model you rely on
AI functions: Main (metadata, tips) and extra (categories, editorial, location, 18+, file type) — counts per function so you know where tokens go
Image quality: Breakdown by Low / Medium / High — see how quality setting affects volume
Filters: By period (e.g. 30 days, March, 2026) and by Count or Tokens—focus on what matters
Where your tokens go. Clear and simple
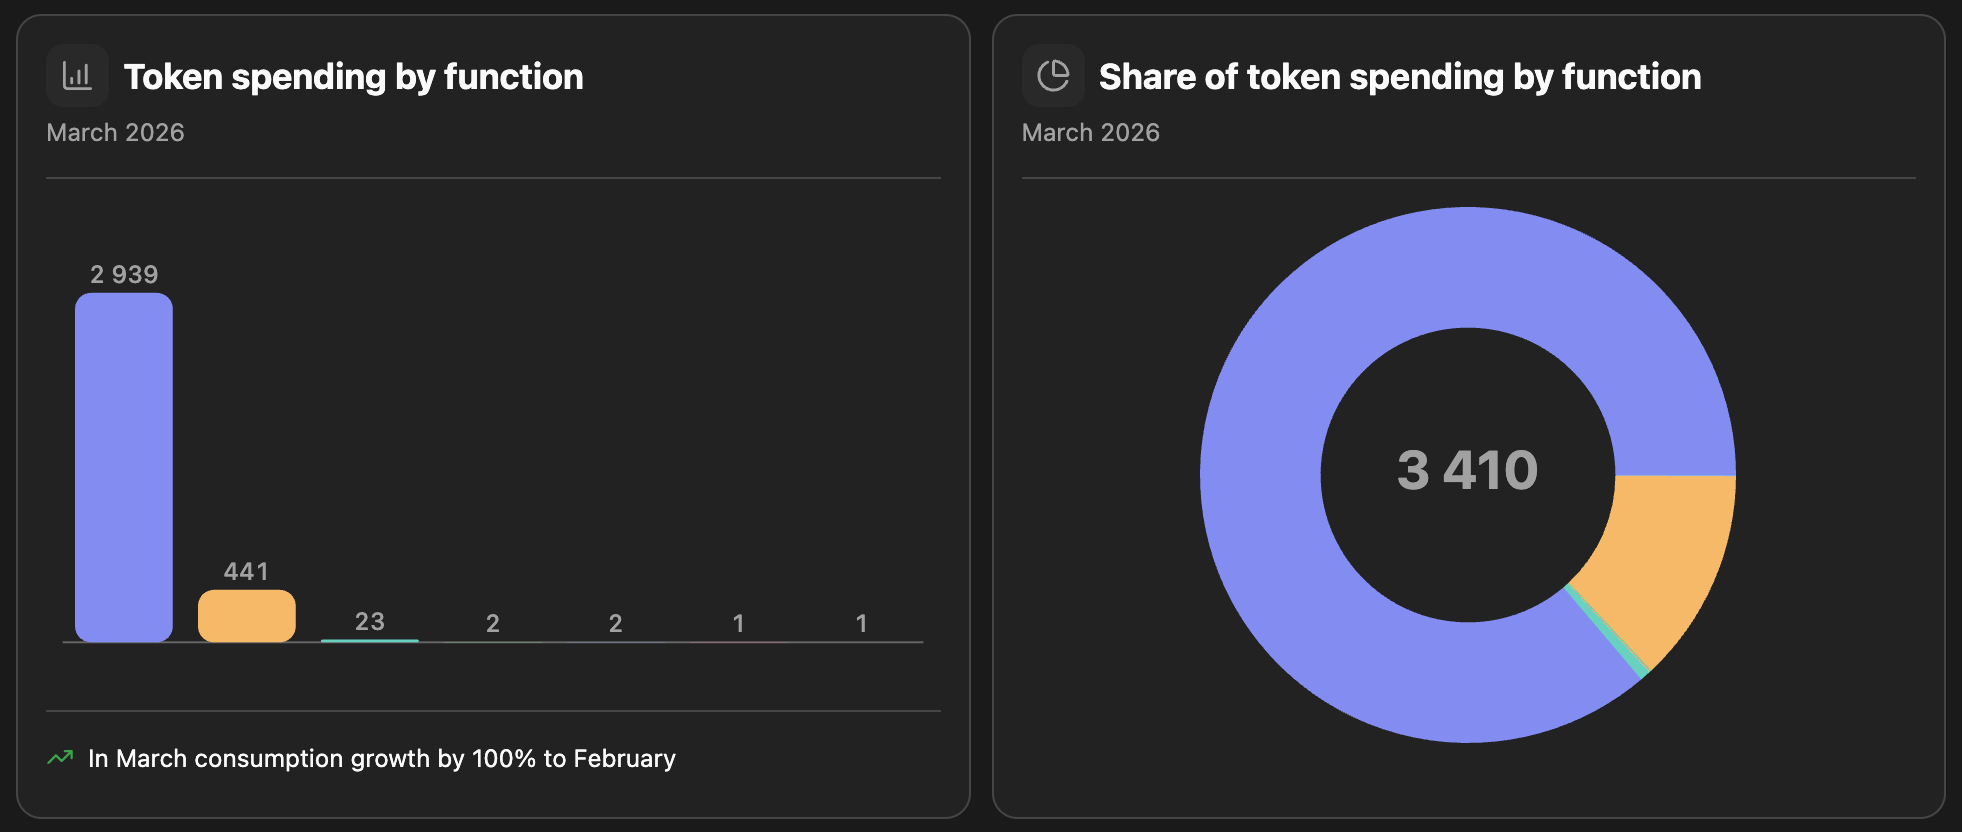
Bar chart: Token spending by function (metadata, tips, categories, editorial, location, etc.) — see which functions use the most
Donut chart: Share of total spending per function — quick view of the main cost drivers
Period: Choose the month (e.g. March 2026); compare totals and structure over time
Growth note: e.g. “In March consumption grew 100% vs February”— see trends at a glance
Every token spend. Full history
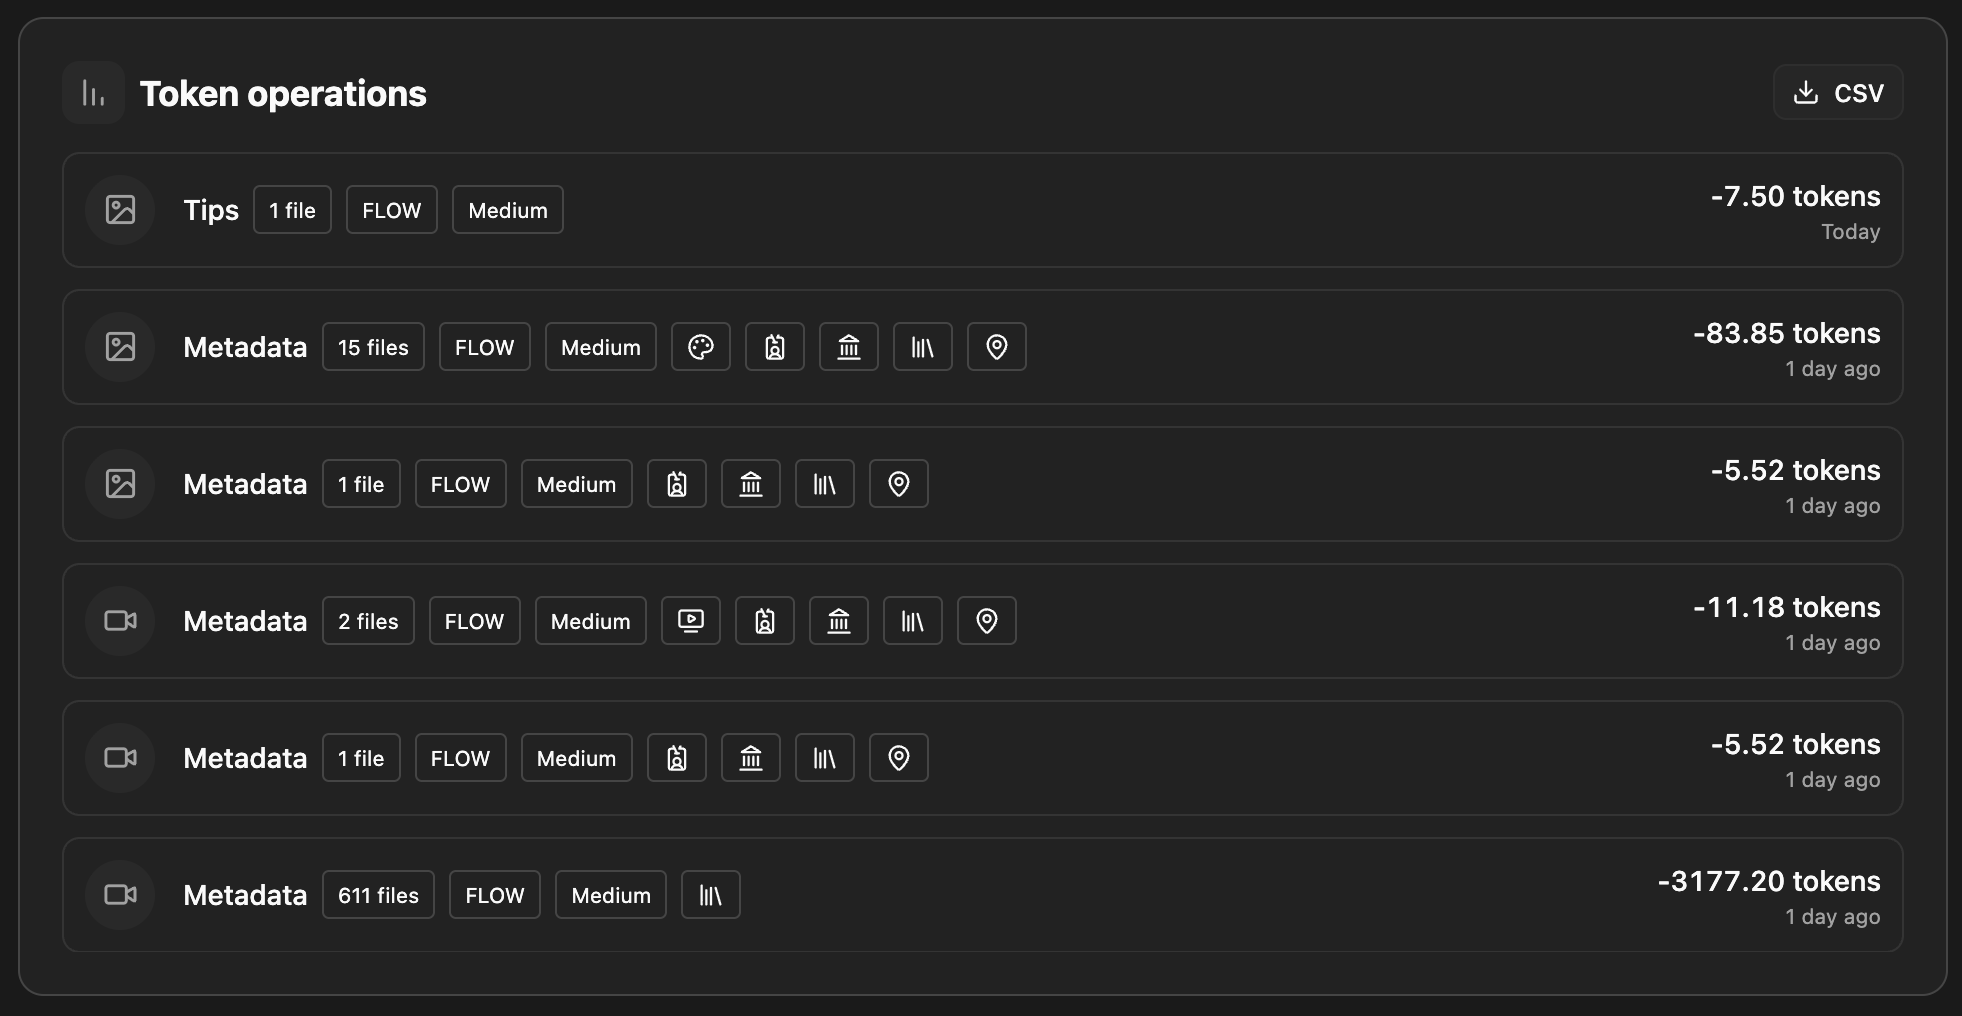
Operation list: Each row = one run: type (Metadata or Tips), number of files, model and quality (e.g. FLOW, Medium), tokens used, date.
Icons: Show what was used — images, video, and which options (categories, editorial, location, etc.).
Transparent: See exactly what each batch cost (e.g. 1 file, 15 files, 611 files) and when
Export: CSV button — download the log for your records, accounting, or analysis
Control: Review past usage and plan next token purchases from real data